# Active Devices
AppSealing is the only cloud-based pay-as-you-go solution to protect mobile apps so pricing for the solution is based on usage of application. Active Devices will shows the total number of active devices for each app secured by AppSealing.
When app launched with AppSealing, the execution log is reported to the AppSealing server, and the Server calculates Monthly Active Devices by Smart phone's unique ID and app's ID. Android smartphone are counted by android id, in the case of the iPhone, AppSealing creates an internal unique ID to identify each device.
To view ADC Hacking Detections (console) :
- Open the ADC console at https://console.appsealing.com (opens new window)
- Login with appsealing account credentials
- In the navigation pane, choose 'Active Devices'
Contents

# Metrics
Active Devices shows active device information about the Application secured with AppSealing. It provides you with the option to set filters on the metrics where you can opt for Operating System (default selected as Android) and Sealing Mode (app mode selected while sealing application).

| Metric | Description |
|---|---|
| Sealing Mode | Test - Test mode provides the same level of security, however a periodic 'Test mode' message is displayed on application Release - Release mode removes periodic message of 'Test mode', along with additional features like real time streaming, signing APK's, etc. |
| Operating System | OS Platform for which the application is sealed Android - Platform used to seal the Native or Hybrid Android apps using Console or CLI tool iOS - Platform used to seal the Native or Hybrid iOS apps using SDK tool |
| Application | Application for which metrics need to be shown, this list will be populated depending on Operating System selection |
# Monitoring
Active Devices shows you active users for your application, the trends will help you increase the set of features for you application, also projectile the cost of appsealing. Information is shown in tiles and each tile provides needful active device information.
Data displayed can be filtered using predefined or custom ranges available in both Daily Active Devices and Monthly Active Devices tile. This also provide you trend of users based on historical data and showing in summary sections.
# Daily Active Devices
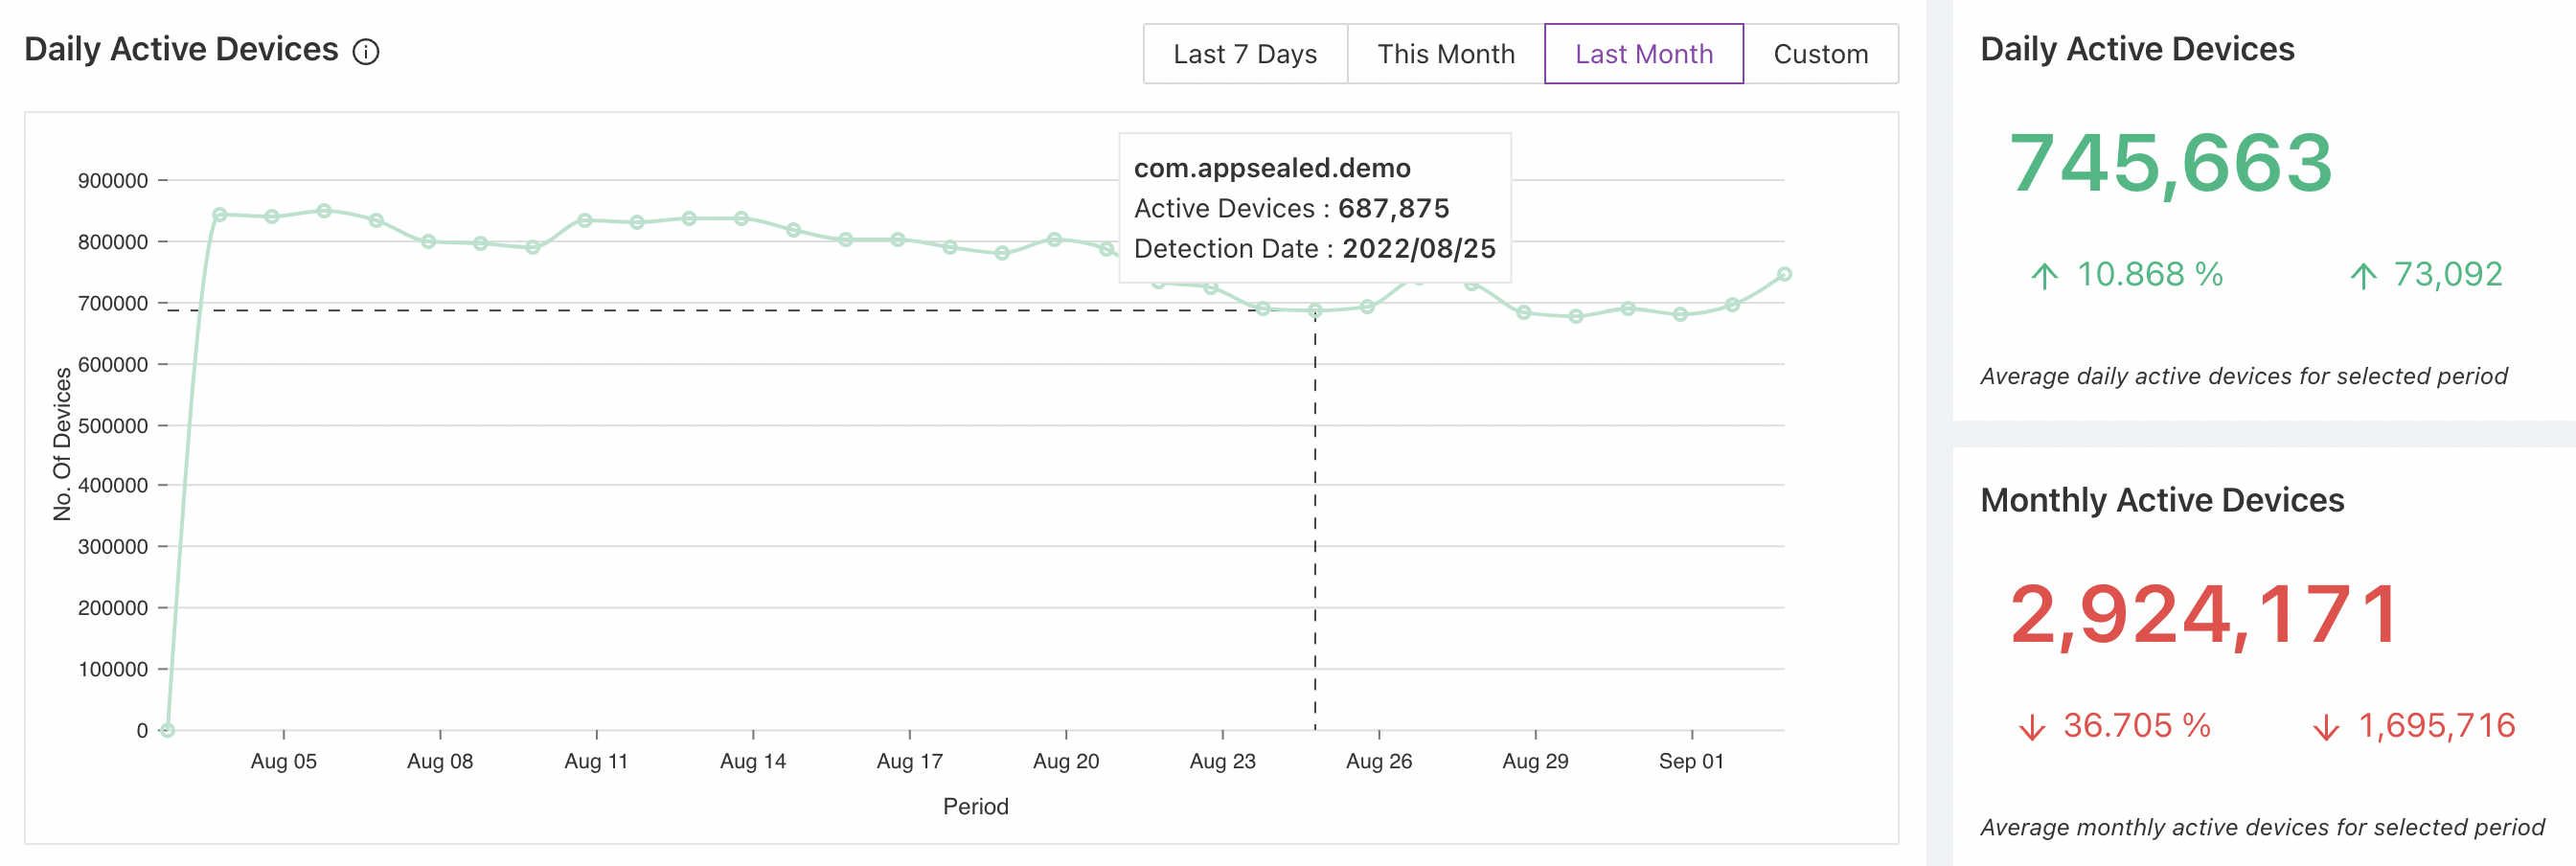
The average number of active users per day who have used the app in a given period. We define an active user as a device having 1 or more foreground sessions within an app during the selected period. You can use pre-defined set of filters ranging from current week to last month or else you can set date range to view specific time period data.
| Axis | Description |
|---|---|
| X-Axis | Date for the selected time period |
| Y-Axis | Represents number of devices active for selected application |

# Monthly Active Devices
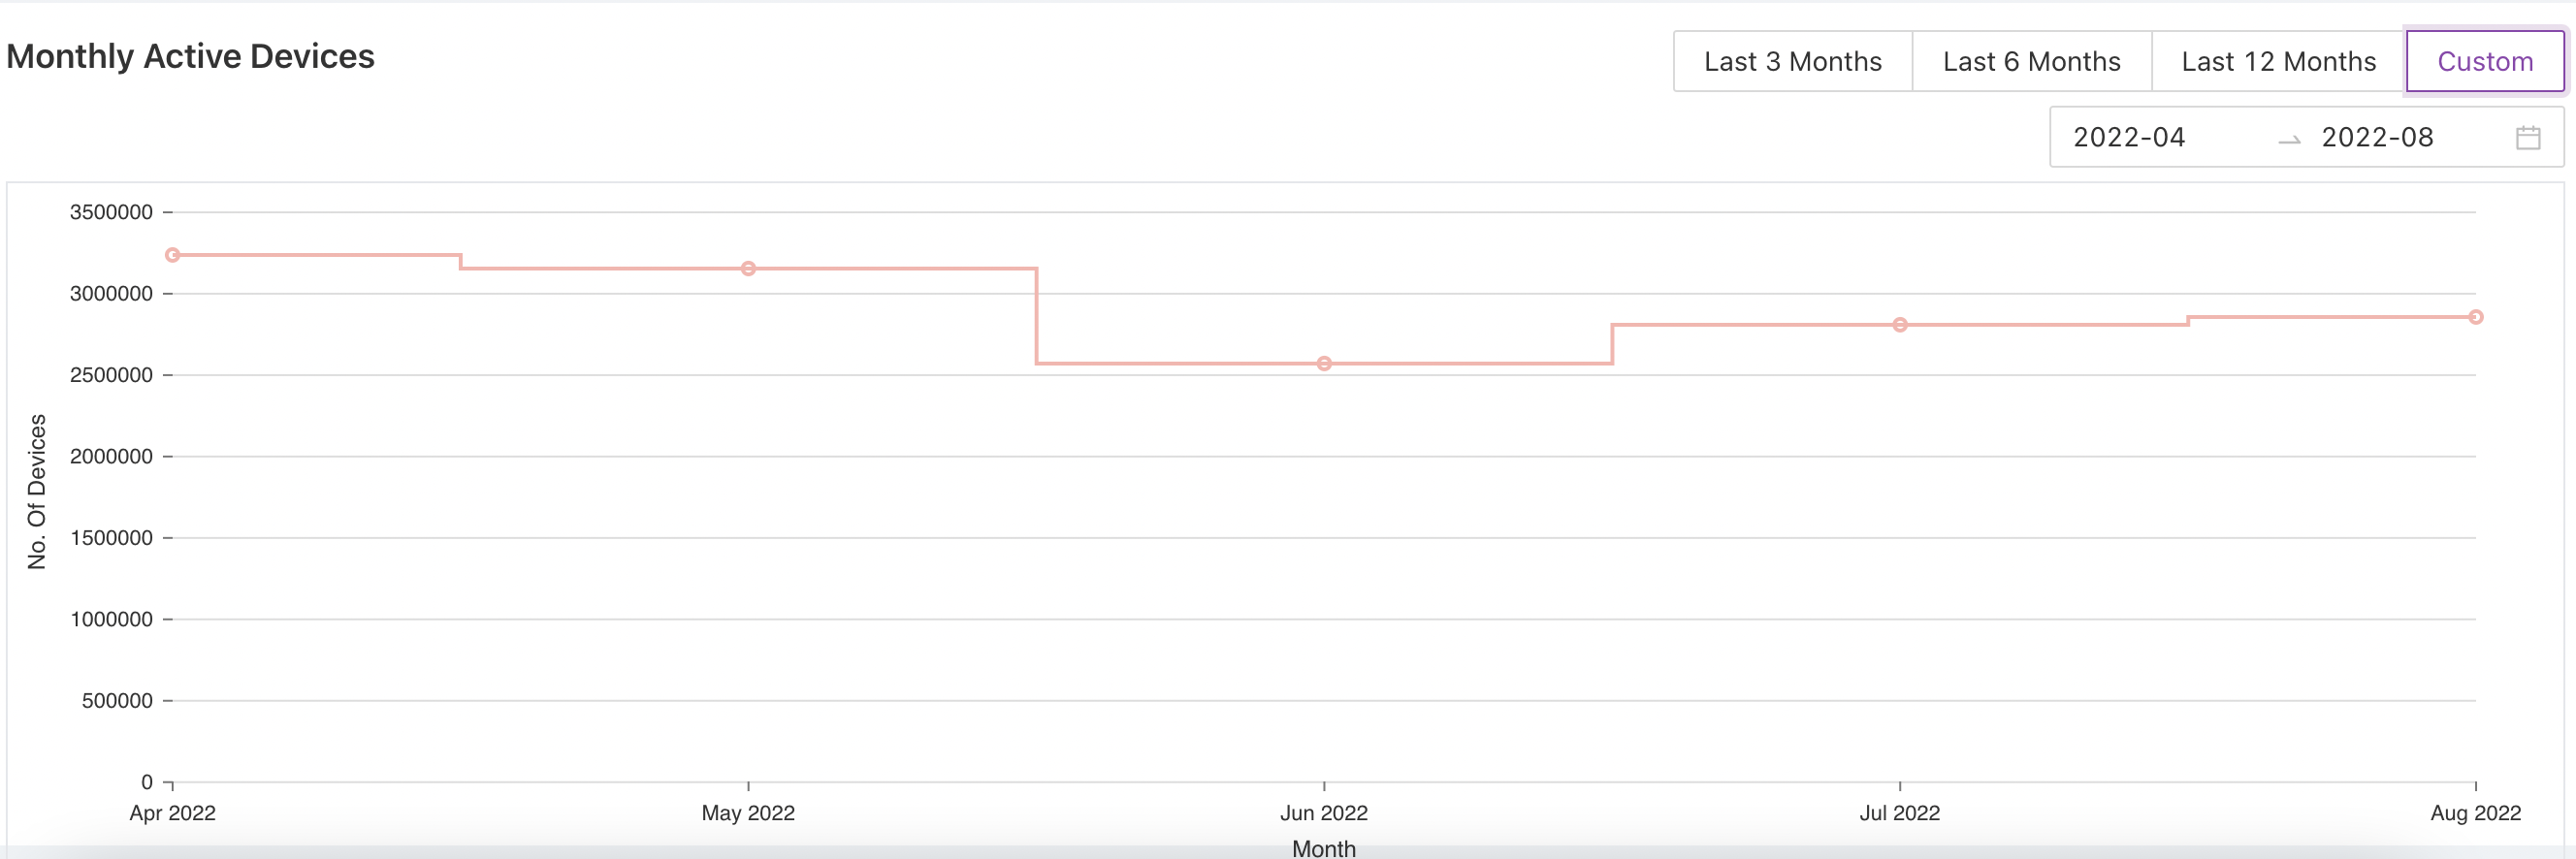
The average number of active users per month who have used the app in a given period. We define an active user as a device having 1 or more foreground sessions within an app during the selected period. You can use pre-defined set of filters ranging from last 3 months to 12 months or else you can set month range to view specific time period data.
| Axis | Description |
|---|---|
| X-Axis | Month for the selected period |
| Y-Axis | Represents number of devices active for selected application |

